Governance Legitimacy Framework
Diagnosing whether governance can be trusted
Aligned with OECD/IDI Report (May 27, 2026) · EO 14402 (April 30, 2026)
Read full definition →
New Essay
GDP Is a Half-Ledger
Why the world's most important economic metric is missing half the story
→
New Book · 4 Languages
Who Walked Away with the Value?
Land, Infrastructure · GL Framework · 2026
→
Free Book
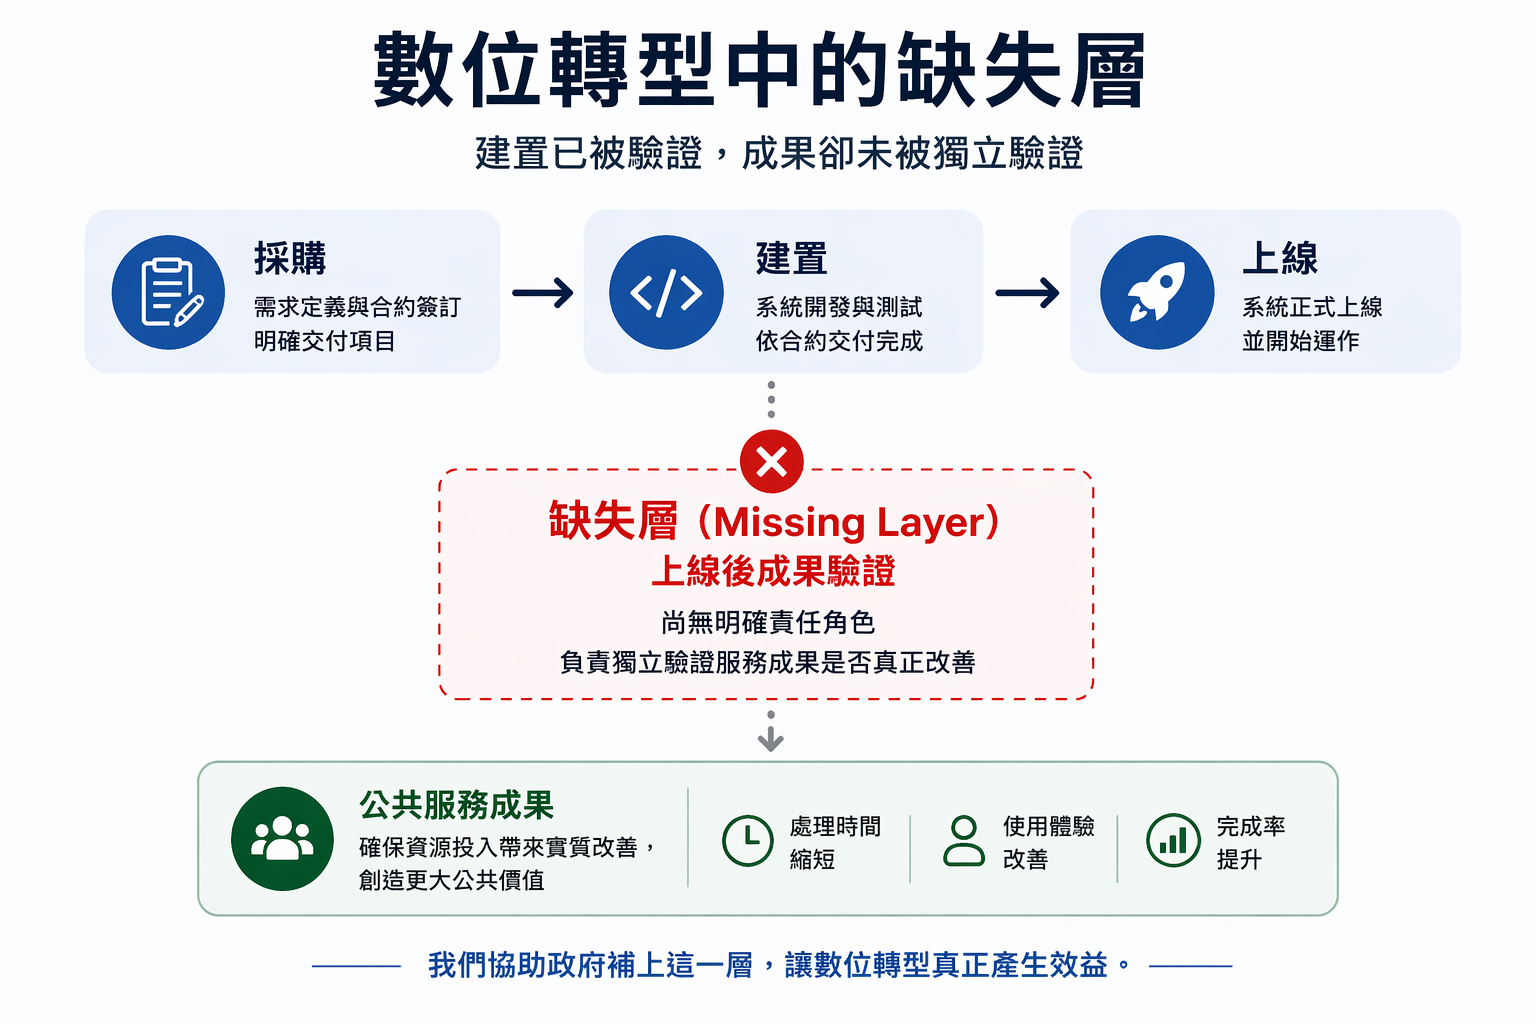
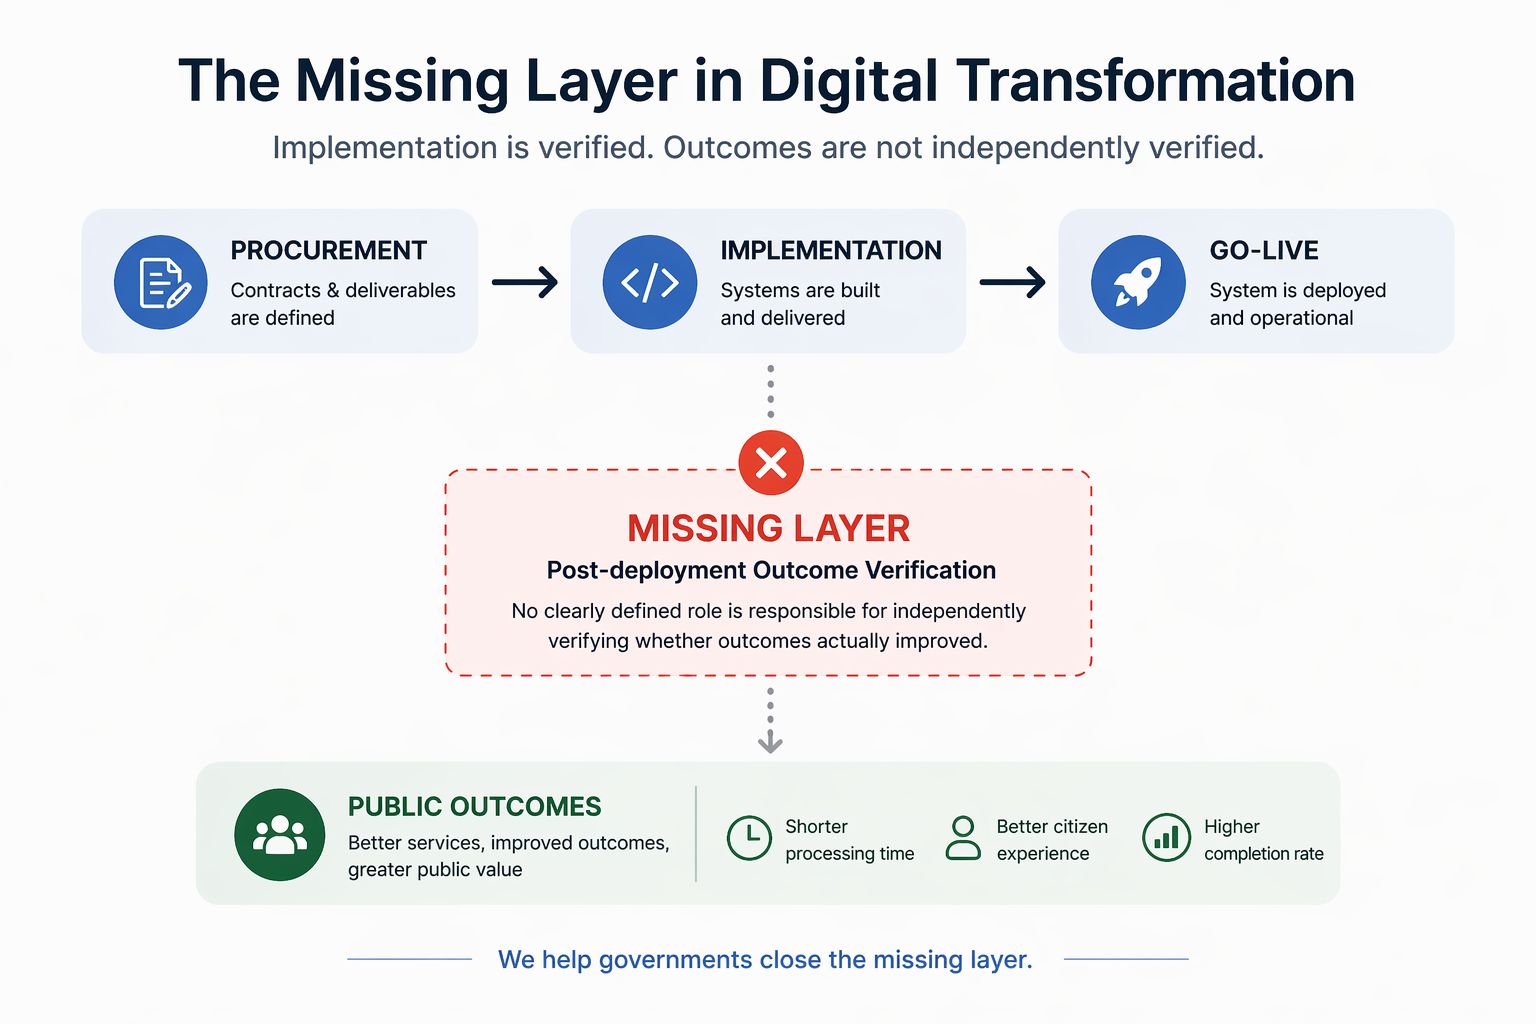
Real Digital Transformation
Free PDF · 107 pages
→
New Tool
Pseudo-Digitalisation Module
GL Diagnostic · 5 indicators · Free
→
📘 NEW ESSAY
Government Failure, Inc.
How consultants broke the state — and why GL Framework diagnoses the rot.
Governments outsourced their ability to do the work. Over time, they lost sight of what they had outsourced.
⚠️ SYSTEM FAILURE
The Lost Generation
When a nation fails its youth, it fails its future.
Young people are leaving — not because they don't try, but because the system is designed to fail them.
🌐 UN HLEG · BEYOND GDP
Beyond GDP, Beyond Reason
One year. 14 experts. 31 indicators. Zero impact.
The UN spent a year reinventing the wheel — then said the wheel is too hard to use.
GL Score: 0.01 — the lowest ever recorded.
⚠️ OMB MISSED THE DEADLINE
EO 14402 Guidance — Still Waiting
June 14 came and went. No guidance from OMB.
Procurement officers: your July 29 deadline is not moving.
Independent outcome verification is available now.
🔴 NEW ANALYSIS
Welfare Policy, Unintended Harm
The US just tightened SNAP work requirements.
Hundreds of thousands may lose food assistance.
A different approach: trust first, verify later.
🧠 SYSTEMS THINKING
Linear Stupidity: Why Control Policies Always Fail
Scared of investment leaving? Ban capital outflows. Then no one invests.
Scared of China getting chips? Ban exports. Then China makes its own.
A GL Framework diagnosis of why "ban it" policies always backfire.
📚 TAINTER · GL FRAMEWORK
38 Years Later, the Same Ruler
In 1988, Joseph Tainter asked: why do complex societies collapse?
In 2026, the GL Framework measures what he could only describe.
A diagnosis of modern institutional failure — with a ruler.
📖 NEW BOOK · 4 LANGUAGES
Performance Governance
How elections choose people who can't govern.
Lawyers, Big 4, and the structural failure of Western governance.
Engineers vs. lawyers · grassroots vs. performance · who should run a country?
GL DIAGNOSTIC CASES
🌐 Global Governance
United Nations HLEG
0.01
The UN spent one year and 14 experts defining "how to measure system failure" — and never measured itself. The lowest GL score ever recorded.
Read the diagnosis →
🇺🇸 National Policy
U.S. Student Loans
0.006
Policy violence. A system designed to fail from the start — borrowers trapped, no delivery mechanism, structural collapse built into the architecture.
Read the diagnosis →
🇬🇧 System Execution
UK ETA Border
0.04–0.09
Pseudo-digitalisation. The system went live — but never actually worked. A textbook case of "delivery failure" disguised as implementation success.
Read the diagnosis →
🇹🇷 National System
Türkiye SGK & Social Assistance
0.067
Structural failure. For every 100 TL of social protection intent, only 6.7 TL of value reaches citizens. A system that filters — not delivers.
Read the diagnosis →
No party. No ideology. Just math.
Case Studies & Analysis
Public Sector
For Government
Procurement, accountability, and outcome verification after deployment.
View page →
Research & Institution
For University & Research
Train GL Verifiers, anchor methodology, build governance labs.
View page →
Public Diagnostic
Public Case Diagnostic Demo
Structured cases from UK, Canada, Australia, US, Germany, Taiwan.
Explore cases →
For Procurement Officers & Vendors
Add a 90-Day Outcome Verification Requirement to Your RFP
Free Tools
Measure · Diagnose · Verify
GFI Check: IMCR + GL Level · Based on GEF (SSRN peer-reviewed)